AN OVERVIEW OF ARGUS EXCEL MODEL
Transcript
Welcome to this video. I am going to walk you through this Argus Excel Model and show you how to underwrite a complex real estate investment within 10 minutes. If you are interested, please visit our website at https://www.financialexcelmodeling.com/ or reach out to info@financialexcelmodeling.com for more information. This model can dramatically increase your productivity and precision. Let’s get into it.
Instructions
The first thing you are going to see is these simple instructions to inform you how to use the model. Click reset button to clean previous data in the model. Since I already click it I will go straight to the input worksheet and start inputting assumptions to underwrite a hypothetical real estate investment.
As rule of thumb, all the empty blue cells are inputs. I am going to input 10/1/2018 for close date. 5 years for holding period, which is 60 months. And ABC as a hypothetical deal name.
Uses and Sources
For the time being, I am going to copy and paste my uses and sources. As you can see, there’s plenty of space for uses and sources section so you can add your line items. I already have my line item names in place. This speed up the process. Most of the them are based on dollar amount and two are based on percentage. If you have more percentage line item, don’t forget we are still in excel so you will be able to change format and cells to meet your needs. Now I finish my uses and sources. I am moving over to debt section.
Debt
Here comes to the debt section. I am going to input 18 months interest only period, 25-year amortization schedule which is 300 months and 5% interest rate. Apart from this, I am going to refinance at 10/1/2020, with a cap rate at 8%, Loan to value 70%, and a 4.5% interest rate. Assume that the Loan to value of mezzanine is 7.3%, and interest rate is 8%.
Market Leasing Profile
In the market leasing profile, we define different profiles that will be assigned to tenants later to avoid repetitive inputs. To save some time, I will copy and paste my profile. There are 13 parameters in each profile, which gives you the control on every aspects of underwriting and they are monthly basis.
Expenses
Then I need to input all the expense names to activate the expense section. Click on INPUT EXPENSE button. This userform is one of the most power features in this model. I can define expense on monthly basis and have complete control on how the expense is going to change. Here I choose to grow the expense by 2% on first month each year. And I am going to do so for all expenses and fast forward a little bit. Now I am finished with userform input. I am going to say all expenses are reimbursable and all expenses are 100% fixed regardless of occupancy except electricity and utilities. 4% for mgmt. fee, not reimbursable by tenants; 1% for Asset Management Fee. Click button to input a flat 0.25 dollar per square foot annual CapEx Reserve number.
Other Assumptions
8% for general vacancy, then click on the INPUT MARKET RENT GROWTH button, 3% for annual rent growth, click on COPY DOWN AND ACROSS, and save. And sum up all reserves number in Total Reserve Cell.
Now I am scrolling back and forth to make sure I have done all the necessary input. Everything looks good. Let’s go to the rent roll worksheet.
Waterfall
Monthly cash distribution to investors, 2 tiers in total. Distribution goes to 8% preferred return first, then return of capital, at last the first tier of 12% hurdle rate, 20/80 split; after hurdle, 30/70 split.
Disposition Assumptions
Moving to disposition assumptions. 8.5% exit cap and 1.25% disposition costs. Now I am scrolling back and forth to make sure I have done all the necessary input. Everything looks good. Let’s go to the rent roll tab.
Rent Roll
I am copying and pasting basic information about rent roll into the model, key metrics like lease start date, lease end date and reimbursement method. Now I am going to input rent schedule for each individual tenant. Click on INPUT LEASE button, we will see similar userform. Input 15.5 dollar and copy down and across. 2% growth each year. Click Calc button to determine timing of inflation. Click save. For this tenant, I will increase rent by 1 dollar each year. Type plus one in the textbox. Click Calc and then save.
If you remember, I define market leasing profile previously in INPUT tab. I get to assign these profiles here. As you can see, individual tenant has different profile and the model is pulling pre-defined profiles and associating them with the right tenants so I don’t have to manually specify leasing assumptions for each tenant. Usually Excel needs to think for a while to finish this process given the amount of calculation going on in the background. So I am skipping this part of video. As you can see, the userform marks the downtime and free rent period for me. After the calculation. I am going to override a market leasing profile reimbursement method. This tenant will have a fixed amount instead of NNN. Input one dollar per square foot. I have the option to customize any leasing assumption parameter. I am scrolling back to make sure everything is in place.
Annual Cash Flow
Let’s check out annual cash flow. There are error signs in cash flow. This can be fixed in INPUT tab. Click on FIX EVERYTHING button, the model is checking and correcting itself. The report will let you know if there is an error that cannot be fixed automatically. Everything is good. Click Ok.
Annual Waterfall
Annual Waterfall tab shows Cash Flow of each tier.
Tenant Monthly
Go to Tenant Monthly tab. All the massive background calculation happens here. There is 3,500 rows in total. In the occupancy tab, the red area means a suite is empty. I can see the building’s occupancy situation throughout the holding period.
Return Sensitivity Table
Moving to the Return Sensitivity Table tab, I have already input the exit cap rate and going-in cap rate. and I will input 0.5% for the Exit Cap Rate and going-in cap rate Incremental. Then click on the UPDATE TABLE button. Now we can see this table provides comprehensive return analysis of general partner and limited partner based on various going-in cap rates and exit cap rates.
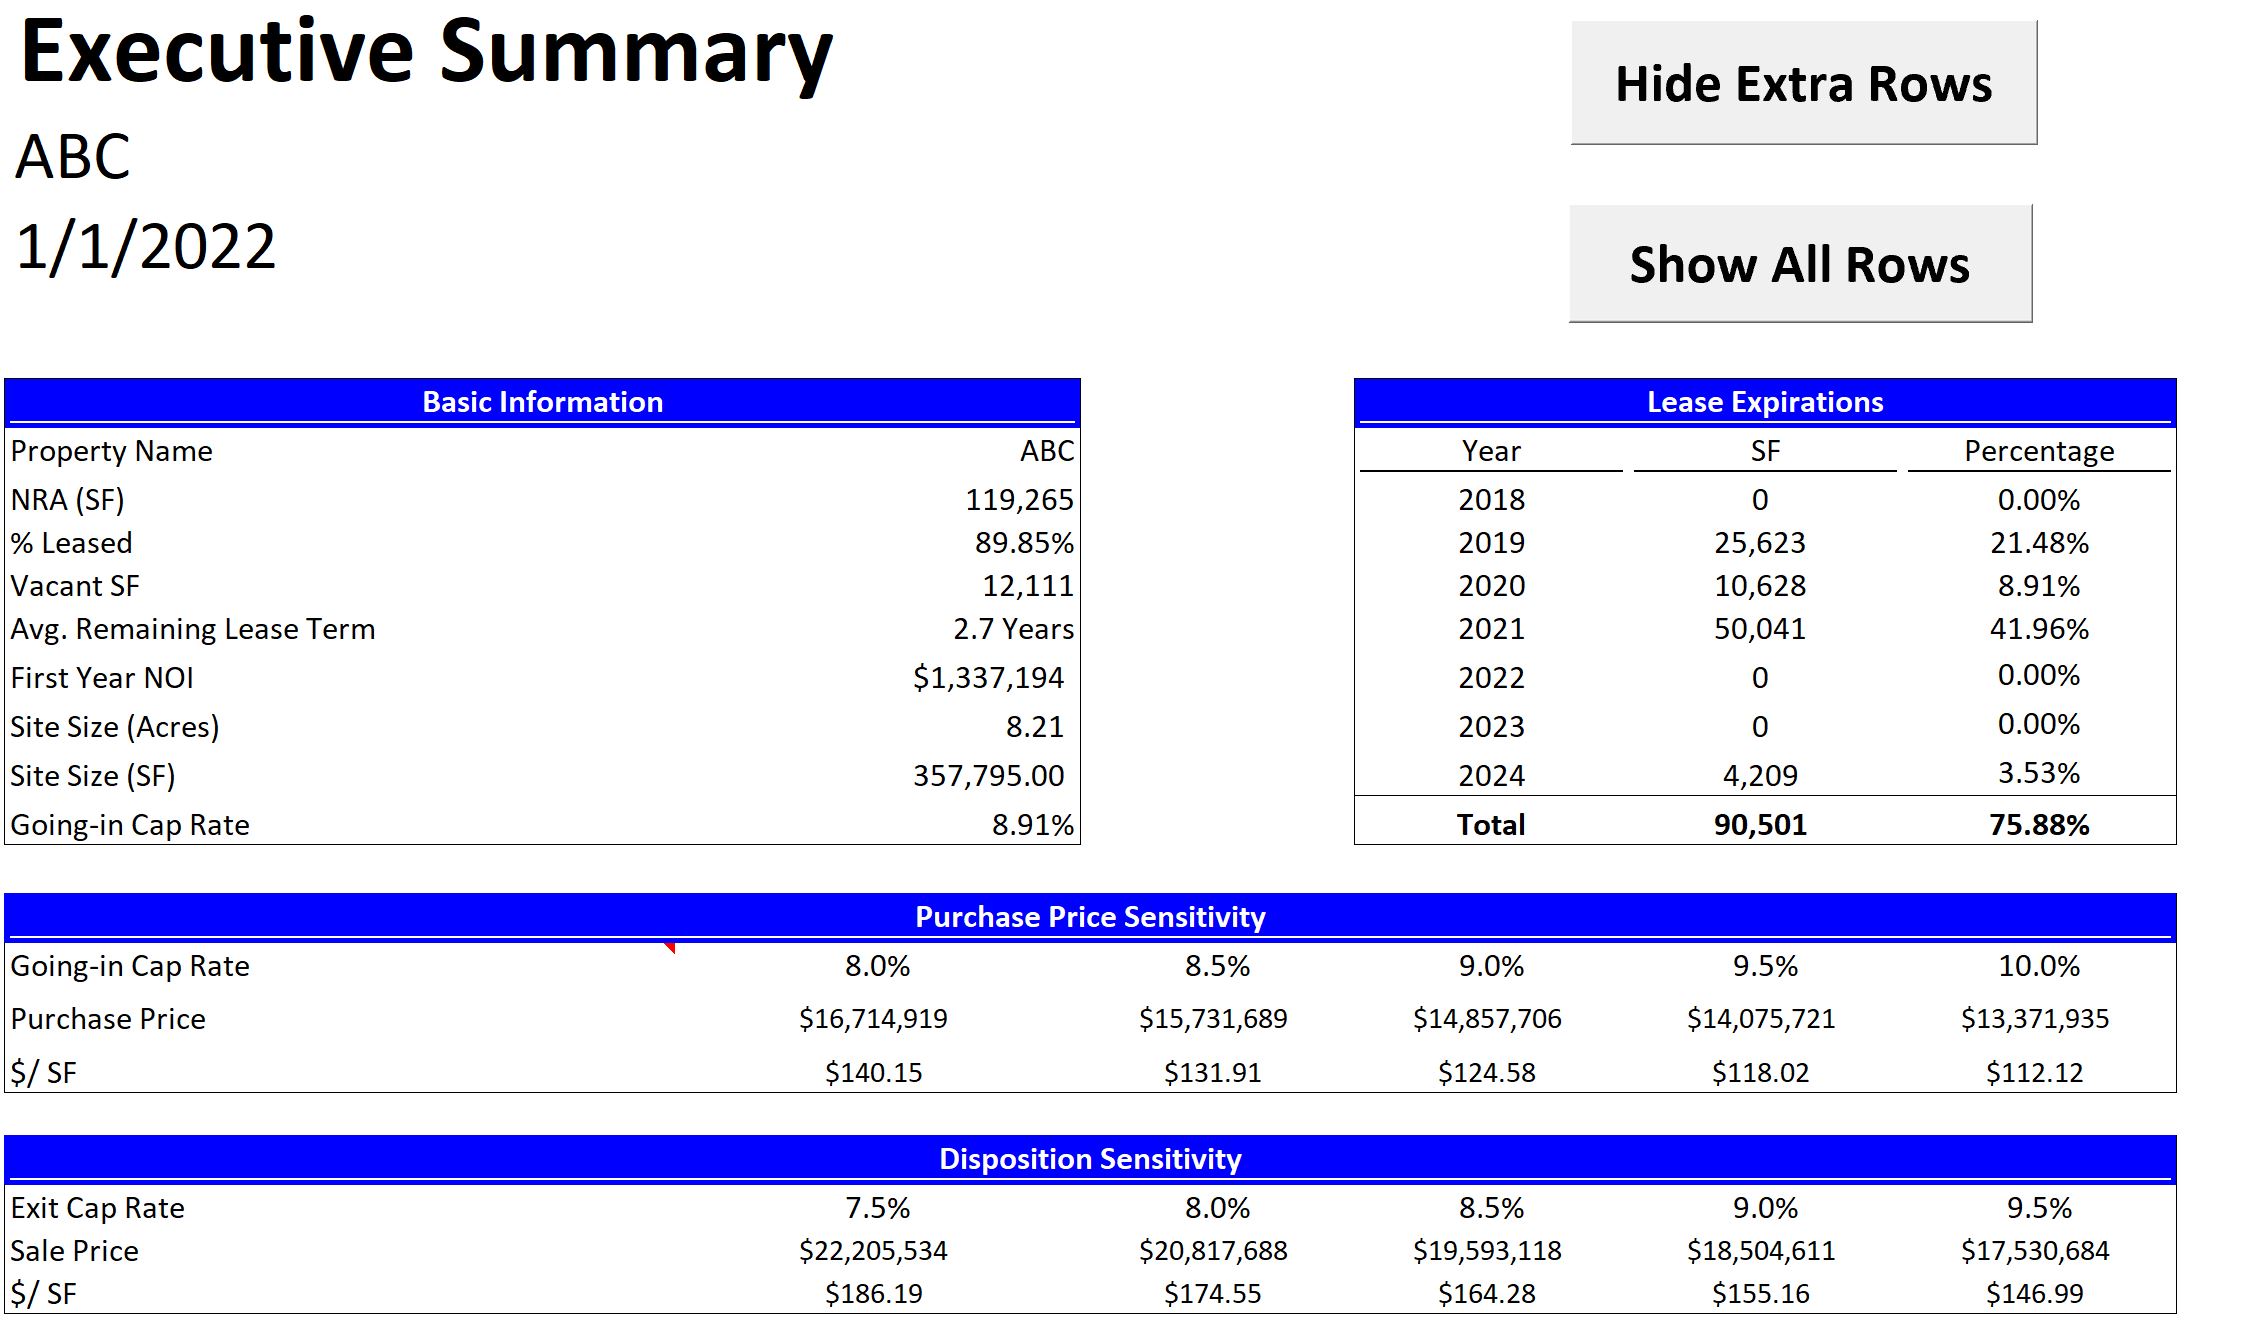
Executive Summary
Last but not least, I need to check out the Executive Summary tab. This tab shows all high-level information about the deal including deal level IRR and GP LP IRR.If you are interested, please visit our website at https://www.financialexcelmodeling.com/ or reach out to info@financialexcelmodeling.com for more information.
Next Article: ARGUS Excel Model - Basic Information Section